Asset Allocation1
There are approximately 41,000 listed companies around the world. This number doesn't even begin to include the even larger market of derivatives based on these companies.
With so many choices, how do people decide what asset classes to buy, and how many % to allocate to each?
Why not just put everything in stocks (e.g. the S&P 500)?
To answer this question, we need to understand volatility, risk and diversification.
You may also want to read about my investment portfolio.
Volatility
Intuitively, volatility can be thought of as how much a stock or bond moves during a period (the standard deviation). Here's a simple visualization.
In the chart above (the S&P 500), the average volatility prior to Mar 2020 hovered around 13%2. This shot up to a high of 75% during the Coronavirus crisis.
Note a few caveats:
- High volatility per se does not imply a high return and vice versa. A stock which is strongly trending can have a low volatility. This is represented in the first half of the chart above - the S&P climbed from 3,100 to 3,400 in 3 months (a 46% return, annualized) - but volatility remained constant.
- Conversely, a stock can fluctuate wildly around its average but have high volatility.
Exposing yourself to high volatility without corresponding high return is not a good idea.
When comparing assets with equal returns, you should prefer the less volatile asset.
Risk
Investment always involves risk, without exception4. Such risk can be broken down as follows:
- Systemic (market) risk - e.g. COVID-19, the Asian Financial Crisis
- Sector risk - e.g. the oil industry being affected by a demand drop
- Company risk - corporate fraud, failed products
- Credit risk - risk of default
- Inflation
- Exchange rate risk
- Interest rate risk
Investors are compensated for taking risk5. This is a fundamental principle.
Imagine that the government is offering bonds paying 2% p.a. A small startup, XYZ Co., wants to issue bonds to investors to raise capital. Now, unlike the government, XYZ Co. has a risk of defaulting. Therefore, you would only consider buying XYZ Co.'s bonds if the interest rate was higher than 2% (or even more depending on the companies' perceived credit worthiness). This is the reason why corporate bonds pay better than government bonds.
Fortunately, some of the risks above can be reduced with diversification.
Diversification
Diversification means buying products from different classes and sectors to reduce exposure to any single company or risk6.
When you do so, you can reduce certain classes of risk. Here's an example.
If you buy stock from a single company, say Microsoft (MSFT), you are exposed to systemic, sector, company and credit risks.
However, if you buy a technology-based ETF e.g. ARK Next Generation Internet ETF (ARKW), you are no longer exposed to the risk of a single technological company going bankrupt. You are, however, still exposed to the risk that the technological sector declines7.
If you want to reduce sector risk, you might decide to buy the SPDR S&P 500 ETF Trust (SPY), an ETF based on the largest 500 companies in the US. Now, you are left with systemic risk, which is non-diversifiable.
Diversification also increases return and reduces volatility.
One surprising result that I read3, was that investors can actually earn more by buying a combination of negatively or poorly correlated volatile investments, as compared to buying just either investment.
Here's an example.
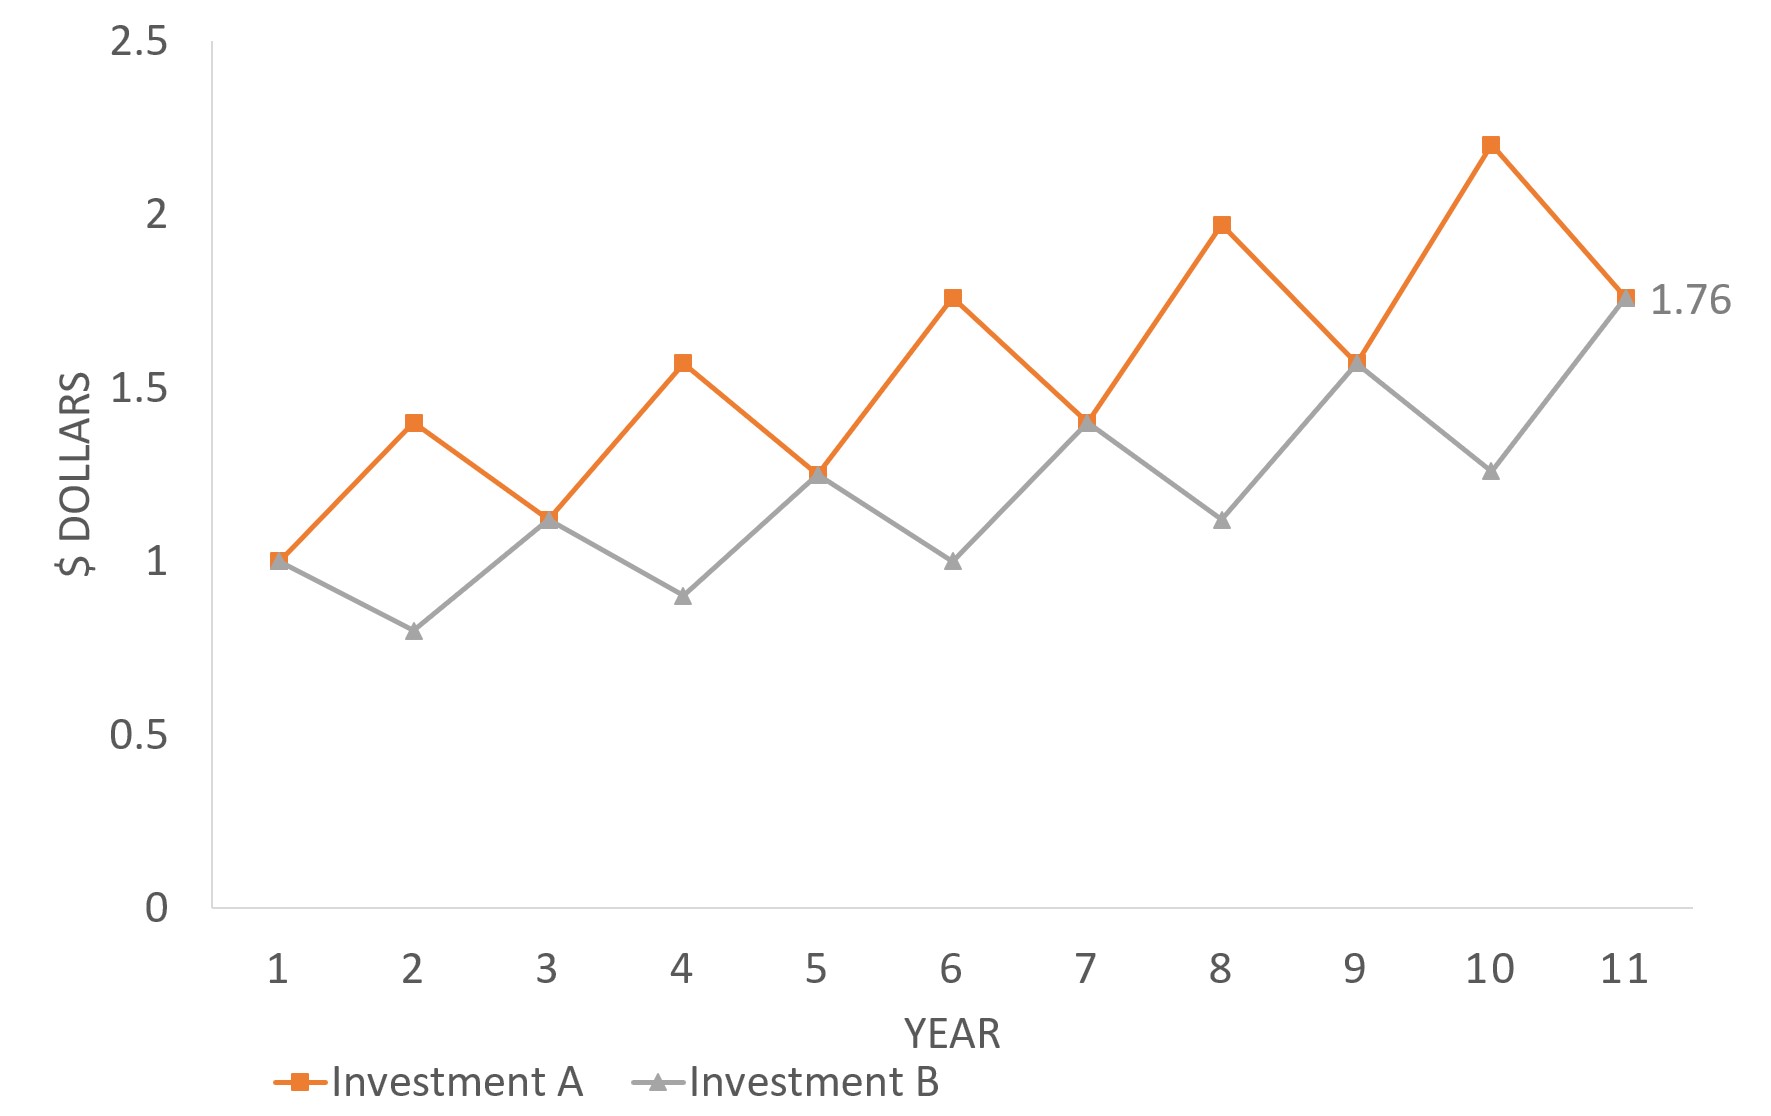
Investments A and B are two hypothetical assets. They have a simple average return of 10% p.a., but they are both volatile, returning 40% p.a. and -20% p.a. in alternating years. They are also perfectly negatively correlated, meaning that when asset A is rising, asset B is falling and vice versa.
After 10 years, the total return is 76%.
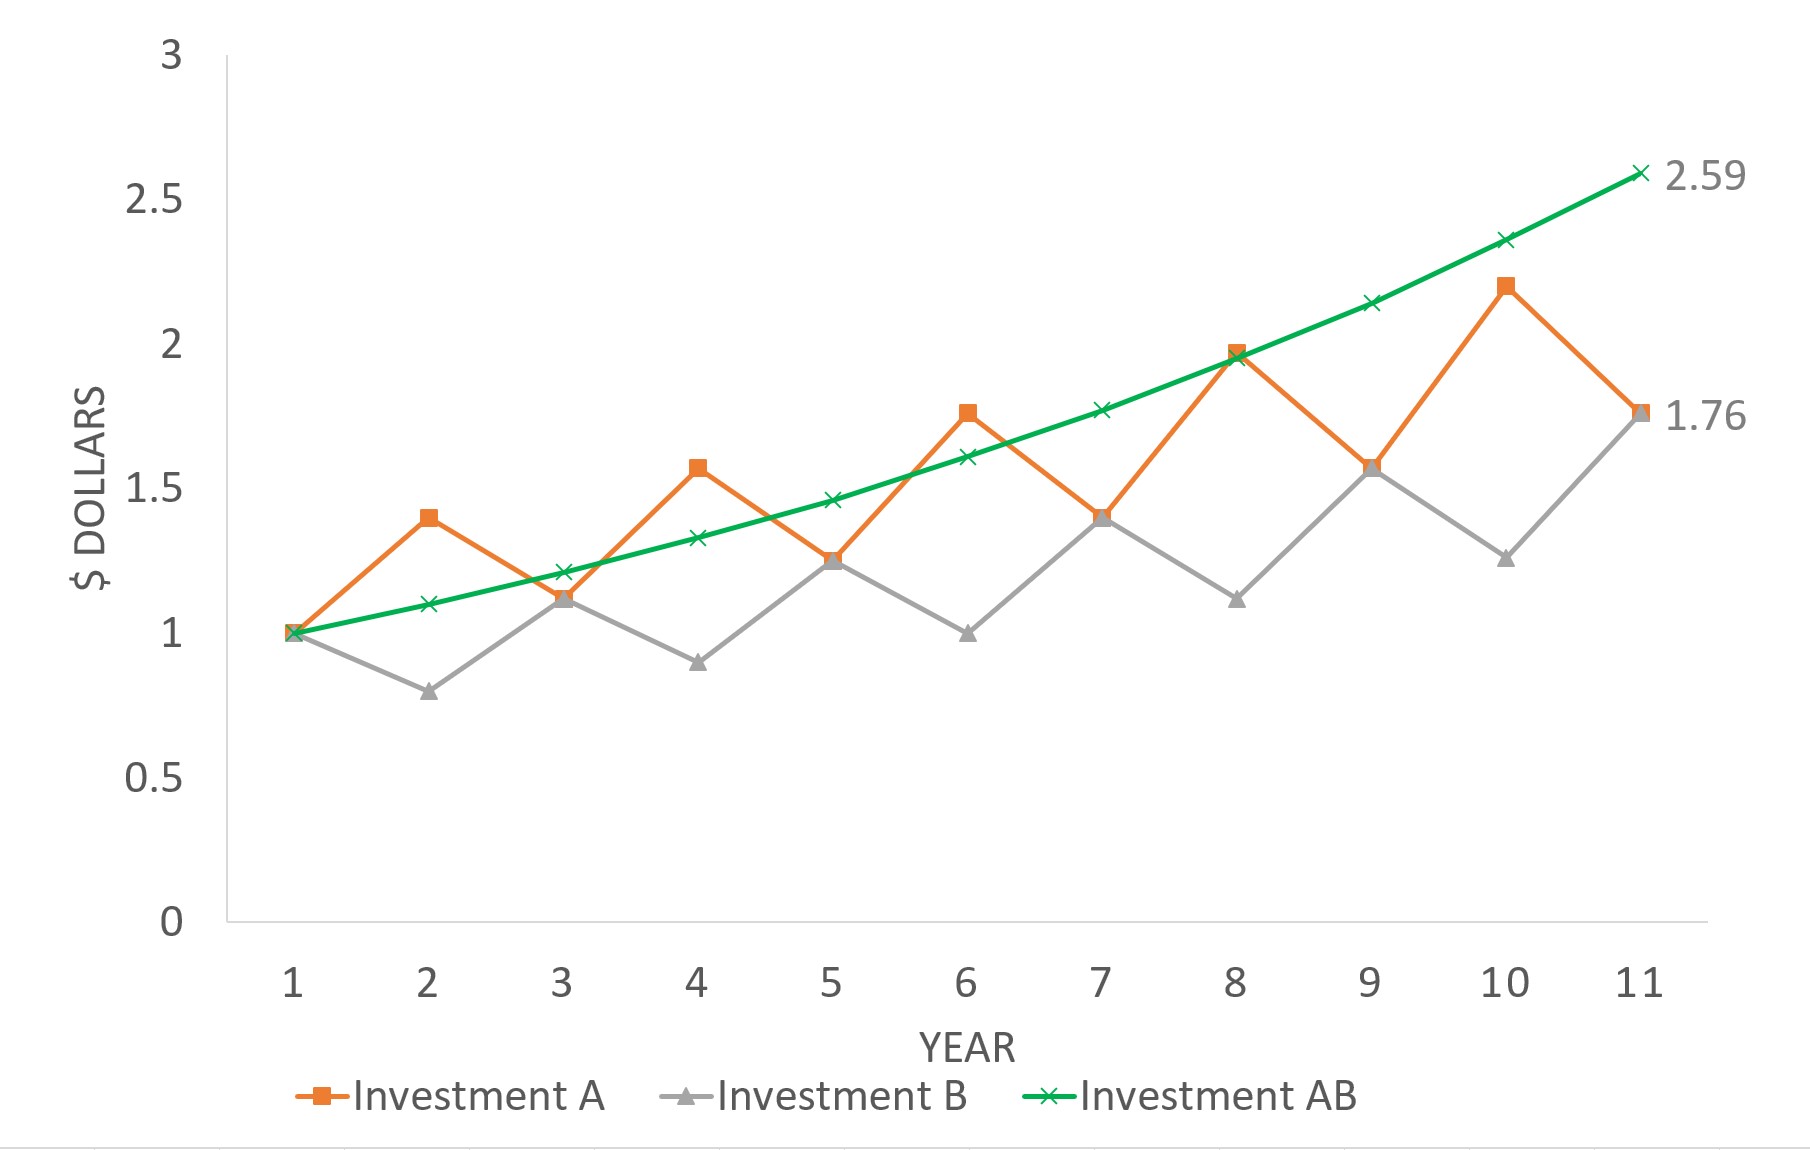
Now let's introduce investment AB, which is a portfolio consisting of 50% investment A and 50% investment B, rebalanced annually.
What do you think the return will be?
After 10 years, the total return of the combined portfolio is 159%. This is higher than the constituents.
Another thing - the volatility of the combined portfolio is lower than either investment A or B alone.
These phenomena occur because during the years where investment A does poorly, rebalancing the portfolio results in a greater proportion of investment A. When investment A subsequently picks up, the portfolio rises as well.
This effect is stronger the more negatively correlated the investments are8.
This is why it isn't a good idea to put 100% of your portfolio in a single asset class (e.g. stocks).
Diversification gets even stranger - in fact, just rebalancing a portfolio consisting of two uncorrelated assets with zero expected return can generate positive return. This is due to the process of rebalancing reducing a factor known as 'volatility drag'.
In short - diversification increases return, and reduces volatility plus risk, all of which are desirable characteristics of a portfolio.
Historical Returns
Now that we've reviewed the key concepts of volatility, risk and diversification, let's look at some data.
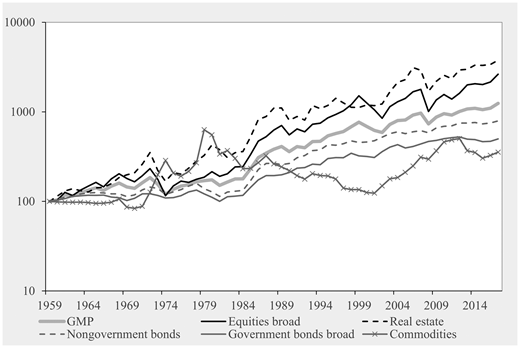
Here are the historical return of various asset classes9:
| Asset | Value of $1, invested in 1925 | Annualized Return since 1925 |
|---|---|---|
| Inflation | $10.98 | 3.0% |
| Treasury Bills | $18.40 | 3.7% |
| Long-Term Government Bonds | $70.85 | 5.5% |
| Large Company Stocks | $2,657.56 | 10.4% |
| Small Company Stocks | $13,706.15 | 12.6% |
Visually10:

A few observations:
- Treasury bills were a poor long-term investment, with most of the returns eaten away by inflation. This is also the reason why investing purely in bonds is not safe - you will lose to inflation.
- Equities in general outperformed the other asset classes
- Although the annualized return for small company stocks was only 2.2% higher than large company stocks, the overall return was 5.15x higher. This illustrates the power of compound interest11.
Should we invest everything in small company stocks then?
No! As mentioned in Diversification, it is important to review the correlations between assets.
In this chart12, a correlation of 1.00 indicates perfectly positive correlation (meaning that when one asset rises, so does the other and vice versa.) and -1.00 indicates perfectly negative correlation
A value of 0 indicates no correlation.
Remember, in diversification we want to choose as poorly correlated assets as possible, for the greatest effect.
From this chart we can see that
- Equities and real estate are rather correlated (0.73)
- Equities were the least correlated to commodities (-0.04)
- Stocks and bonds were somewhat correlated, more with nongovernment bonds (0.52) than government bonds (0.27)
Portfolio Creation
Now, we know we have to own equities, bonds, commodities and real estate for the benefits of diversification. But in what percentage?
The full answer is mathematically involved. We shall explore it briefly.
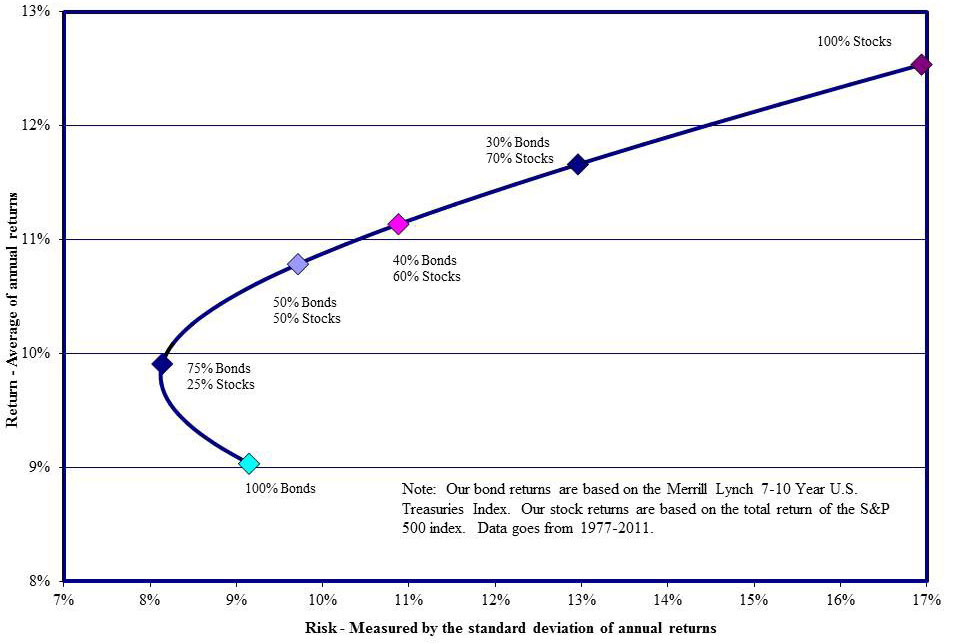
The chart above13 plots return against volatility for a porfolio consisting of stocks and bonds14.
Note that as the composition of the portfolio shifts, the return and volatility change. Initially, return increases while volatility decreases, up to a certain point.
That point represents the portfolio with the lowest possible risk - due to diversification.
We can run computer simulations15 on a basket of assets to determine the mathematically optimal allocation. However, the inputs to the computer models - namely expected return and standard deviation, are themselves unknown on a year-by-year basis.
Fortunately, the same data has shown that diversified portfolios with different allocations have performed very similarly.
In other words, the exact allocation is not important.
That being said however, I wouldn't jump into a 100% stock or commodity portfolio. Some observations:
- Stocks and real estate perform similarly to each other
- Bonds tend to be the least volatile, compared with equities and commodities
- Commodities are negatively correlated to equities, but they have had the lowest compound annual return, so you wouldn't want too much in these
You must also consider personal factors:
- Your own risk appetite - what is the maximum drawdown (aka loss at a point in time) you are willing to bear?
- Are you planning to retire?
- Your job stability
- Whether you have dependents and need a large, fixed sum in the future for school fees
If you like rules, here are some:
- Keep your age (in percentage) in bonds, and the rest in stocks (John C. Bogle)
- Hold no more than 80% of your assets in stocks/equities
Conclusion
You can see my asset allocation here for ideas.
The earlier you start, the faster the magic of compound interest can begin. The road goes ever on and on16, and so shall your journey into the world of investing. Nothing worthwhile is ever easy.
I hope you enjoyed reading this article as much as I did writing it. Do drop me a mail if you have questions!
-
Much of the material here is adapted from my readings of:
- A Random Walk Down Wall Street, by Burton G. Malkiel
- The Bogleheads' Guide to Investing, by Taylor Larimore, Mel Lindauer, Michael LeBoeuf
- Asset Allocation, by Roger Gibson
-
To be exact, this is the volatility as measured by the VIX, a market index measuring the implied volatility of options on the S&P 500. ↩
-
Described in Chapter 7 of Asset Allocation, by Roger Gibson ↩
-
Sadly, keeping your money under your pillow still bears the risk of misappropriation and inflation. ↩
-
Technically speaking, one can only reduce diversifiable risk (sector, company, credit risks.) Non diversifiable risk includes systemic risk. While one cannot 'diversify away' such risks, time is your friend here - the market has, and will, rebound from all systemic crises. ↩
-
E.g. people waking up one day and realizing 'AI' ain't what it claims to be. Google Assistant cannot answer questions a 7 year old kid can, such as 'If I have 2 marbles in my left hand and 3 in my right, how many marbles do I have?'. ↩
-
In reality, no assets exist with perfectly negative correlation. ↩
-
Adapted from Asset Allocation, by Roger Gibson. This paper also compares historical return over various asset classes since 1960. ↩
-
The 8th wonder of the world. A helpful calculator is available. ↩
-
This chart is known as the efficient frontier. Mathematically speaking, the line contains the set of all efficient portfolios, that is, these portfolios that have the minimum risk for a given level of return. Inefficient portfolios are not represented in this graph, but visually they would lie within the hyperbola. This is a consequence of Modern Portfolio Theory, formulated by Harry Markowitz, winner of the Nobel Prize in Economics for this same discovery. ↩
-
The technically minded can consider reading Efficient Asset Management, by Richard O. Michaud for a more in-depth journey and critique of mean-variance optimization. ↩
-
From Lord of the Rings. ↩


